Posts

Showing posts from September, 2020

GIS 5935 Module 4

Image
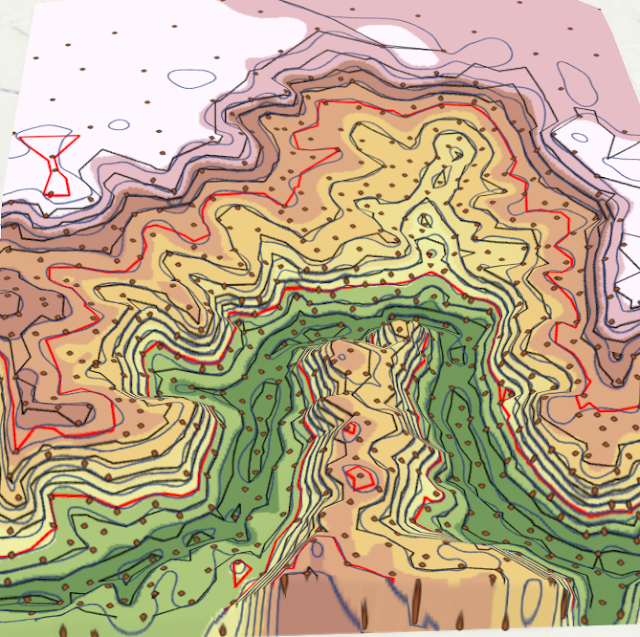
Triangular irregular networks (TIN) and digital elevation models (DEM) are explored and compared as models for representing terrain. TINs, as indicated in the name, are models composed of nodes and connecting vertices (Bolstad, 2016, Chpts 2 and 11). DEMs are generally composed of pixels. They both have data on terrain and ground elevation and can be used to explore similar topics.  In this module, I explored TINs and DEMs in five different examples. I will focus my discussion here on one example, where I believe the difference between the two data types is best illustrated. In this example, a TIN is compared to a DEM derived from input shapefiles, and both are used to create contour lines across a terrain.  A point and study area feature layer are added to a local scene, and used as inputs to create a TIN of the elevation. A DEM is then created using the Spline tool, which uses input data to create a smooth surface passing through the X,Y, and Z values of the input points. This tool c

GIS 5935 Module 3

Image
In this module, a completeness assessment is conducted on a Street Centerline data set provided by the Jackson County, OR.  The completeness of a data set refers to the extend that the data set contains the features it represents. Unlike positional accuracy standards, which have established methodology and accuracy thresholds from national and international standardization organizations, measuring the completeness of linear features like roads is not standardized (Bolstad, 2016, Chpt 14). This means that it can be left up to the party assessing the data to create their own methodology.  In assessing this data, a greater understanding of the data quality can be achieved and can also be included in data quality reporting. Users can determine if this data set is adequate for their purposes and choose to use it or seek another source.  Methodology: This assessment looks at the completeness of road networks based on length of road segments within Jackson County, OR as compared to a road net

GIS 5935 Module 2

Image
In this module, formally established methods of determining accuracy standards are reviewed, notably the National Standard for Spatial Data Accuracy (NSSDA). This is a national standard for determining the confidence of point positional accuracy. This method uses a sample of real and test points selected at random to generalize the accuracy of the entire data set. As an example of this practice, I tested the accuracy of two road maps of Albuquerque streets, one provided by the city of Albuquerque, and one a USA street map. Those these data layers are lines and not points, points are placed at intersections and used to test the accuracy of the road segments. Other methods for determining positional accuracy of line segments, such as the epsilon band method, are not formally standardized ( Bolstad, 2016, Chpt 14) . Using NSSDA guidelines and procedures, confidence of both data sets is determined and reported to the nearest foot. Methods:  1) Divide study area: Study are is divided into