GIS 5935 Module 4
Triangular irregular networks (TIN) and digital elevation models (DEM) are explored and compared as models for representing terrain. TINs, as indicated in the name, are models composed of nodes and connecting vertices (Bolstad, 2016, Chpts 2 and 11). DEMs are generally composed of pixels. They both have data on terrain and ground elevation and can be used to explore similar topics.
In this module, I explored TINs and DEMs in five different examples. I will focus my discussion here on one example, where I believe the difference between the two data types is best illustrated. In this example, a TIN is compared to a DEM derived from input shapefiles, and both are used to create contour lines across a terrain.
A point and study area feature layer are added to a local scene, and used as inputs to create a TIN of the elevation. A DEM is then created using the Spline tool, which uses input data to create a smooth surface passing through the X,Y, and Z values of the input points. This tool creates a DEM pixel-based raster file, and has settings to adjust the fineness/smoothness of the output file.
The two outputs have been added to the same map, and are both used to display contours. The method for adding contours to a TIN and DEM are a little different, but TIN offers a very easy and quick way to set symbology for slope, aspect, elevation, angles, contours, and other features right in the symbology settings for the layer. The DEM requires the use of a contour geoprocessing tool.
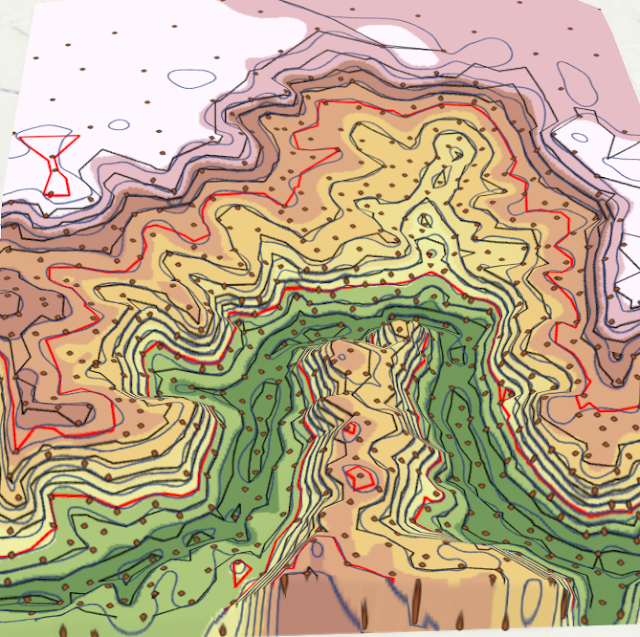
My immediate and most striking observation of the difference between the resulting data layers are the smoothness and level of detail contained in the DEM vs the TIN. The TIN, because it is contained of nodes and vectors, lacks the ability to produce very fine smooth curves along the contours. The DEM on the other hand, is able to produce very smooth curves along the contours. This can be seen in the image below, where the sharp, red lines are the contours of the TIN and the dark grey contours are from the DEM.
 |
| Terrain model showing DEM contour lines in grey, and TIN contour lines in red. The color scale shows slope with five classes, and is defined by the DEM. |
From this, I can conclude that the DEM is able to produce finer detail with the input datasets than the TIN is. This is likely because the DEM is made of pixels, and greater interpolation can be done with DEM rasters than TIN.
As cited in the text, DEMs have been greatly explored because they have existed for a long time, and their applications and subsequently, the tools associated with them, are very well developed (Bolstad, 2016, Chpt 11).
Sources:
Bolstad, P. (2016). GIS Fundamentals: A First Text on Geographic Information Systems, Fifth Edition (5th edition). XanEdu Publishing Inc.


Comments
Post a Comment